Pages

Labels

Showing posts with label financial management. Show all posts

Thursday, November 15, 2012

What exchangeable bonds are

Exchangeable bonds are a way for countries and financial institutions to borrow money from capital markets with specific terms. In some cases, countries may make use of financial institutions such as investment banks to underwrite or facilitate the issuance of these bonds to supplement monetary policy. Otherwise, exchangeable bonds can be issued by central banks and traded via bond exchanges.

Exchange

A key feature of exchangeable bonds is they can be traded for stock held by, but not of the issuer according to Reuters. In other words, exchangeable bonds are similar to convertible bonds because they can be exchanged for stock, but not the stock of the issuer. The price at which stocks are acquired is important in receiving an equitable exchange for the bond. For example, if a 10 year bond with a face value of $1,000.00 yields 4 percent per annum at an inflation rate of 3 percent, the value of the stock should equal the present value of the annual payments plus the bond's present value per the  New York University Stern School of Business bond valuation method i.e. $931.46 at the time of issue.

Rates

Rates on exchangeable bonds vary, but have been as high as 5.25 percent for Portuguese exchangeable bonds and as low as 1.5 percent for those issued by KwG Bank Group. The yield of bonds is linked to the credit rating and demand for the bonds, but also by how much an issuer is willing to borrow money for. To limit opportunity cost, the rate at which exchangeable bonds ideally equal the highest yields and lowest price of existing bonds with the same credit rating in either primary or secondary bond markets. Furthermore, if bonds are purchased in a secondary market their purchase price can also be discounted if new issues of the same bond offer a higher rate.

Terms

Issuers of exchangeable bonds can do so with conditions such as bond recall or cash exchange option. This is evident in exchangeable bonds issued by the Portuguese Government. Moreover, these particular exchangeable bonds were issued with the understanding that the issuer would maintain ownership of the exchangeable amount of Galp Energia shares until traded. However, the issuer also had the option to keep those shares and instead offer cash with value equal to the average trading price of those shares in exchange for the bonds. Additional conditions of exchangeable bonds include the qualifying exchange period and recall of the bonds prior to their maturity date.

Risks

Exchangeable bonds that are rated by agencies such as Moody's assist investors in evaluating the risk level of the bonds and the credibility of the issuer. In some cases 'events' such as legislative adjustments can cause the terms of an exchangeable bond to change. Predicting these events is not an exact science but can be assisted with a review of the economic and market trends in addition to analysis of existing bond yield curves. Other risk includes opportunity cost and market risks such as transaction speed, or inaccurate inflation discount rates and/or risk premium in the case of exchangeable bond repurchases.

Monday, November 12, 2012

How will Obama's re-election affect the finance industry?


The whole of the US waited with baited breath to hear the results of the election, perhaps none more so than financial sector workers. The election results have a dramatic effect on the markets, both immediately and long term. Promises made by government affect possible future performance of different market sectors. The news of Obama’s re-election potentially means many different things to different sectors of the market. The financial industry will be affected not only by changes to its own regulations but also by stock and share price fluctuations due to the addition or withdrawal of government support.

The finance industry


Barack Obama has said that he wishes to more strictly implement financial reforms in the Dodd-Frank Act than before, which will impact on insurers and investment banks which may have been getting away with more than they should. The profits of private equity firms may find their profits plummet as currently favourable tax policies for dividends and capital gains are likely to change. Traders dumped stocks in banks as they realised that Obama’s promised regulatory changes would prove costly to implement. The Dow-Jones industrial average plummeted by 369 points within the first two hours of trading on Wednesday, around 2.8%.

Healthcare


The phased implementation of Obama’s Affordable Care Act will benefit millions of US citizens. It has also already had an effect on the financial markets. Following the election results, on Wednesday hospital share prices rose across the board. Healthcare stocks overall traded around 1.4% down but the majority of the loss was in insurers’ share prices. Community Health Systems share prices rose by 6%, Bloomberg Industries hospital stock by 6.1% and HCA and Tenet Healthcare prices went up a huge 9.5% over the course of just that one day.


Energy/chemical companies


While renewable energy companies will be well backed by the Democratic government, other power suppliers saw stock prices plummet as traders dumped stock following the election. Obama’s promise to bring in more strict regulations to the energy industry as well as finance saw stock prices fall as everyone scrambled to rid themselves of burdensome stock in a hurry. The Obama cabinet are unlikely to invest in coal and it looks likely that the US coal industry will become more or less obsolete in a very short space of time. Obama is extremely keen to replace fossil fuels with renewable energy sources as widely as possible.
Attached Images:

This post was written on behalf of www.schemeserve.com – who have extensive knowledge about Lloyds insurance software and other financial services.
Image attribution 1|2|3

Monday, October 22, 2012

How to keep cash flowing into your business

By Gerwyn Wallto 

Keeping cash flowing into your business is essential for ensuring the success of your financial endeavor. What you will need is a management system that will allow you to keep track of all the inputs and outputs of your business, so that you will never run out of money. An online cash flow management system is the best recommendation because it can keep an eye on all your business financial aspects, without having you experience as little as a headache. Here are some of the things that online cash flow systems can help you with. 

Accurate calculations 

It is often said that if you fail to plan, you plan to fail. The same thing is valid when it comes to cash flow management. You will need to know exactly how much money is coming in, and how much of it is going out, as well as the durations of time that pass between inputs and outputs. An online cash flow management system can keep track of all these aspects for you, and in a very accurate way, so you will never have to worry that you have forgotten about a certain pay-in or pay-out and mess up your entire financial schedule.


 Keeping track of good paying customers

Online cash flow systems can serve you in many ways. For instance, a good online cash flow management will be able to keep track of good paying customers and you will be able to reward them with a small discount, for instance, in order to make sure that you keep them as your clients. Also, reliable online cash flow software will allow you to differentiate between good clients and customers that often delay payments. In the later case, you can insist that they pay on delivery, so that your cash flow is not affected.

Watching out on your expenses

With online cash flow management, you will be the one in charge of all the expenses. You can schedule their payment in a way that allows cash to flow into your business continuously. For instance, you can program the payments to be done automatically just before their due date, to make sure that you have access to liquid cash for as long as possible. For businesses, such an advantage is not to be taken lightly. Online cash flow management offers you the means to monitor all your expenses and payments all the time, and also the means to choose the best solutions for your business.

Monday, September 3, 2012

Accounting: How special purposes entities work

Image attribution: FreeDigitalPhotos.net; standard royalty free license

Special Purpose Entities (SPEs) are legal structures such as trusts that provide financial benefits to companies seeking to enhance their financial management. To illustrate, SPEs facilitate 'asset securitization', a form of borrowing against reorganized assets that can lower the cost of capital. Moreover, although more difficult with increased regulation, SPEs allow for off-balance sheet debt that are an advantage to organizations due to 'cleaner' appearing financial statements. In addition to the protection of assets that would otherwise be exposed to legal claims per Robbins, Salman & Patt, Ltd., special purpose entities also allow alternative options for depreciating assets according to the CPA Journal.

SPEs have come under increased scrutiny due to abuse of these financial mechanisms in the past. A corporation named Enron created a financial scandal large enough to spur more focused accounting rules because SPEs were the mechanism used to manipulate accounting data and deceive investors. However, in the CPA Journal, Jalal Soroosh Phd and Jack T. Ciesielski CPA state these regulations are insufficient to stem problems associated with misleading shareholders. For example, in the past, by not owning 50 percent or more of an SPE, but maintaining control of it, corporations avoided consolidating SPE financials such as debt into their own balance sheet.

It is important to note the date of accounting commentary such as that in the CPA Journal as it can predate ensuing accounting regulation of SPEs. The Financial Accounting Standards Board (FASB) continually establishes official accounting standards that companies must follow when preparing financial statements; this includes the aforementioned rules pertaining to special purpose entities. Furthermore, official accounting rulings such as FASB Statements 166 and 167 eliminated 'qualifying special purposes entities' and increased corporate disclosure requirements for organizations utilizing SPEs.

Federal Accounting Standards Board regulation of SPEs does not eliminate their use however. Moreover, although the size of loans assumed by special purpose entities must be  accounted for under newer FASB rules, loan transactions via SPEs can still qualify for off-balance sheet documentation  according to BDK, LLP. Jon McDowell of BDK, LLP describes this 'loan participation' as involving proportionate ownership and full exchange of assets between interest holders that can in cases excluding 'sales' of loans qualify for off-balance sheet recording. 

Despite the continued existence of SPEs, The Basel Banking Committee reaffirms the added affect FASB rulings 166 and 167 have on SPEs. Specifically, the committee states the changes made in 2010 “significantly reduce the ability of certain transactions to qualify for off-balance sheet treatment.” In any case, when investing knowing if a company makes use of SPEs, which set of accounting rules a corporation is subject to i.e. International Financial Reporting Standards (IFRS) or Generally Accepted Accounting Principles (GAAP), and closely examining corporate disclosures can all assist in being better aware of that businesses' financial activities.

Thursday, August 16, 2012

Guide to surety bonds

Image attribution: Freedigitalphotos.net; standard royalty free license

Surety bonds are a mechanism that protect individuals and businesses from certain kinds of work or service related performance problems. For example, according to the Small Business Administration (SBA) surety bonds on contracts are like insurance, and guarantee individuals or organizations work will be finished according to predetermined specifications. Moreover, in the case of payment surety bonds, those completing the work are guaranteed payment per the SBA.  

Depending on the service being performed and which party is seeking guarantee, specific kinds of surety bonds are used. According to State Farm Insurance, many kinds of surety bonds exist including permit bonds, contract performance bonds and public official bonds. Each type of bond serves a particular function of surety. To illustrate State Farm also claims license bonds assure clients whose contractors are 'licensed and bonded' that they will receive services such as electrical work within allowable standards. 

Surety bonds are not like Treasury bonds that are purchased in full and pay interest. Neither do they pay for claims like insurance companies do according to JW Surety Bonds. Rather, only a percentage of the surety bond's full surety coverage is paid by the buyer to guarantee service, work or payment. To make a claim against a surety bond, a filing of that claim and subsequent investigation similar to other types of insurance takes place. However, unlike many types of insurance, the buyer of the surety bond and not the seller is responsible for payment or service.

If a business, contractor or official holds a surety bond, it not only gives 'surety' of their services, but can improve their marketability. This is because guaranteed service is more likely to have a higher value to paying clients and assuming competitive pricing and functions of a business, provides a market advantage if competing businesses are not bonded. In some cases, especially in reference to government services, surety bonds are mandated. For example, surety bonds on Medicare equipment supplier services are required by the Department of Health & Human Services.

For buyers of services, it may not be enough if a business simply states it is bonded. The specific type of bond and the buyer's right to make claims against that bond are ideally verified for good measure. To confirm the authenticity of surety bonds the registration of the surety bond issuer can be verified with the U.S. Treasury Department. Following this, and upon successful identification of issuer legitimacy, that issuer or surety company can also be contacted to determine whether or not a specific company or service provider is indeed bonded.

Wednesday, August 15, 2012

How book building works

Image attribution: Freedigitalphotos.net; standard royalty free license

Book building is the valuation of  new financial securities carried out by securities underwriters known as book runners. When a company issues new bonds or shares, they have to be priced. This pricing is performed by the book builder(s) who market the new financial instruments for the issuing company. This price assessment is partially based on a measured demand for the security by both institutional, private and public investors. However, book value for securities is also determined using financial formulas such as the discounted value of future cash flows.

Initial public offerings (IPOs) such as the Dunkin' Brands Group, Inc. IPO in July 2011 serves as an illustration of how  additional issuer based valuation influences book building. The IPO had shares offered at $19 per a July Wall Street Journal report. Arriving at this initial offering price is theoretically the role of book building, but is also be influenced by the issuers capitalization needs. In other words, if the IPO is designed to raise money, the amount of money to be raised can influence the IPO price per share regardless of book building valuations.

In light of the competing motives behind IPOs the process of book building involves capitalization requirements, buyer demand for financial securities, and actual valuation of corporate worth as represented by the financial security. Some financial observers also believe book building undervalues valuation. For example, in academic research published by New York University and authored by two professors named Boyan Jovanovic, and Balázs Szentes, it is suggested initial public offerings are pre-valued below actual worth before soliciting bids from buyers in an effort to share 'super-normal' returns with preferred clients for business purposes. 

The actual value of shares to be offered via an IPO are only issued shortly before the offering takes place according to research in the Journal of Corporate Finance. Moreover, according to this research, yet another variable affects the valuation of book building. Specifically, regulatory environment as evident in the form of opt out rules. In other words, the author of the study demonstrates that since book-builders can withdraw their offering of securities if demand is not high enough, the undervaluation that can take place during IPOs is accepted due to the surety made possible via the opt out option.

The function of book building is fundamentally straightforward, however what actually happens when organizational entities seek to raise funds by issuing financial securities via book-building isn't quite so simple. This process and the valuation of securities is carried out by book-builders that are securities underwriters or book-runners. However, the actual price of the securities offered, IPOs in particular, are affected by several factors including book-builder financial motives, the issuer's financial security, and investor demand.

Tuesday, August 14, 2012

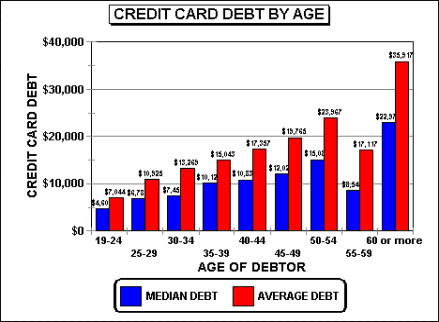
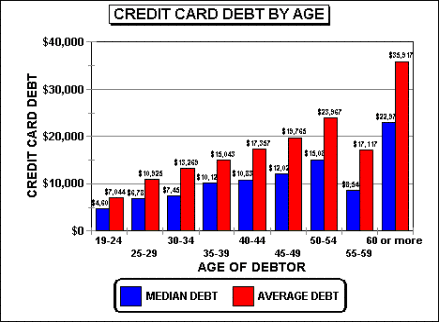
Debt management warning signs


Increased debt burden often has the capacity to magnify financial stain on household budgets. Tackling that increased debt before it gets out of control is assisted by recognizing the warning signs you are headed into debt problems. Moreover, the reason it is beneficial to spot financial red flags early on is it better facilitates amelioration of debt related financial obstacles before they get big enough to cause financial damage.

The Experian credit rating agency recommends keeping credit card balance to limit ratios low. In other words, if you find credit card debt becoming an increasingly higher percentage of total credit limit, it could be an early warning of larger debt problems. Small debt problems can creep up incrementally and sometimes go unnoticed. These small increases in debt snowball after time and become larger debt problems that make money management more difficult.

Depletion of savings

A savings account balance that declines even just a few dollars a month could be a warning sign debt problems are ahead. To find out if it is a warning sign follow the money trail. If the money from savings is being transferred into another savings account then it is more likely to be a re-shuffling of assets. However, if that savings balance is declining because of transfers to a checking account or for debt payments, then it could be signaling a potential debt issue.

Lower credit rating

By keeping track of credit scores consumers stay aware of how credit rating agencies view their credibility. Since these agencies themselves have measured credibility, it naturally follows a declining credit score means they have found financial reasons to substantiate a lower credit score. This credit score is itself an indicator of decreased ability to manage debt and potential warning sign of debt problems. The industry credibility of credit rating agencies such as Equifax and Transunion is measured by credit research performed by 'non-partisan' organizations such as the Policy and Economic Research Council (PERC).

Higher monthly debt payments

Another warning sign of potential debt problems is higher monthly debt payments. In some cases, a higher monthly debt payment may be due to mismanagement of cash-flow, however at other times it may indeed be a debt warning sign. Moreover, if higher debt is due to cash-flow, it may be resolved by a rescheduling of payments to fit income schedules. However, if the higher debt payment is due purely from increasing debt, then that too could be a warning sign of bigger debt problems down the road. The relevance of that warning also rises if the pattern of increasing debt payment continues over time. 

Overdraft charges

Overdraft charges are another potential debt warning sign. As with high monthly debt payments, these charges may be due to mismanagement of cash-flow. However, at other times they may indeed be a debt warning signal, especially if they increase in frequency and deplete the ability to pay debt. Said differently, overdraft charges themselves are a debt related expense, and too many of these charges can throw off monthly budget payments designed to pro-actively manage debt leading to higher debt payments later on.

Monday, August 13, 2012

How the accelerator effect works

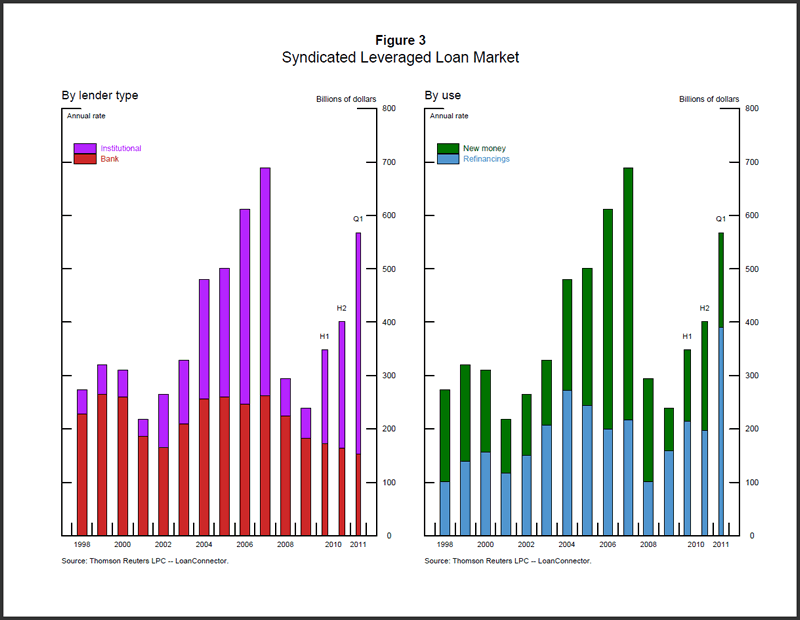
Syndicated leverage loan market 1998-2011 
 Indicates how financial markets coincide with economic conditions


The financial accelerator effect is the outcome financial circumstances relating to business and market outlays have in terms of specific economic conditions. More specifically, according to Ben Bernanke, Chairman of the Federal Reserve Board, the accelerator is itself a change to “financial and credit conditions” that affects the business operating environment. For example, if interest rates rise, the cost of capital also rises; if the business environment is experiencing a down-cycle, then the rising interest rates are thought to accelerate the negative impact of the business down-cycle which in turn influences economic conditions. 

A key function of the accelerator effect is to explain why certain financial conditions occur. When a cause for specific events can be proven to be the accelerator effect, then the reason for fiscal circumstances and actions can be illustrated and justified with more validity. For example, in a research study by an Bruno Coric Phd of the University of Spilt, it is claimed the accelerator effect itself serves as a model with which changes to business “outputs” are related to financial markets. In other words, the accelerator effect is a substantiated economic tool in the context of which economic scenarios are made clearer.

Even though there is some explanatory power to the accelerator effect, it is not completely illustrative of economically related financial scenarios. Moreover, as Ben Bernanke of the Federal Reserve and  Simon Hall of the Bank of England point out, the scenario described as the accelerator effect is not due to unique causes. Moreover, other variables also influence the economy which impact the accuracy of the accelerator effect as an explanatory tool. For example, even if financial obstacles such as access to financing are prevented from inhibiting business operation, there is still the question of how using available money would be profitably beneficial. 

Measurement of both economic and financial impact is also a key function of the accelerator effect. In a report by Amundi Asset Management the accelerator effect is measured by determining the quantitative changes to corporate investment behavior when economic stress is experienced in money supply, loans to firms, credit conditions and employment. To explain further, by gathering economic and corporate data, trend lines or 'financial affects' are measured. When these trends are statistically correlated to preceding and separate but similar economic scenarios, the impact of the accelerator affect can be numerically illustrated and corroborated.

Guidance is another function of the accelerator affect. The more an economic event can be demonstrated to be the accelerator effect, the greater the perceived utility of specific forms of monetary policy become. In other words, the affects of adjusting monetary policies to influence economic conditions are in part substantiated by the accelerator effect. In this context, if the cause of the financial accelerator is inhibited, the consequence in theory would be a reduction in the ability of that financial mechanism to amplify its economic impact leading to a change in the accelerator effect.

Wednesday, August 10, 2011

Inflation as an extended source of economic stimulus is questionable

In a back issue of the New Yorker Magazine the idea of inflationary stimulus is discussed as a way to facilitate debt reduction and possible increases to consumer spending. The example given in the magazine is debt accumulated by the United States during the 1940s as it became more manageable after inflation. This is because the debt management metrics were presumably not chained to inflation, and therefore as the amount of currency within the system increased, old debts shrunk proportionally to the money supply. The subsequent paying off of such debt then increases confidence in the economy and causes its borrowing costs to decline.

This strategy has been suggested as a remedy for the current weak U.S. Economy by experts such as Harvard Professor Kenneth Rogoff in a PBS interview. Moreover, when a central bank prints more money or indirectly increases the money supply via open market operations, the value of equity and commodities rise. In one sense this is good if those commodities are local. However, when they are not, as in the case of imported oil, inflationary pressure serves as a financial weight or tax to consumers. In the case of inflation of equity and oil commodities, artificially inflated 401(k) values counteract consumer price increases. However, this balancing out combined with a decline in national debt could perhaps serve as an economic stabilizer by not allowing things to get worse.

When an economy has systemic issues not tied to inflation, the above measures are not as effective. Moreover, inflation that's costs are paid for by the government also cancel out lowered debt. For example, a rise in healthcare costs paid for by government services such as Medicare does little to improve an economy that has lowered its debt burden via central bank monetary policy on interest rates. Additionally, exports can rise when the value of the dollar declines. However, that's no guarantee businesses won't up prices to keep up with costs. The value of currency also declines with inflation in which case individual net worth declines with out the proper inflation protection.

Increasing inflation at a slow rate can correspond to economic expansion when the amount of real national product increases and inflation rate rises along with it. This kind of inflation is not necessarily fiscally toxic, however higher levels can be risky. For example, if inflation rises too high, confidence in national Treasury Securities can wane causing higher costs to the government. The Federal Reserve Bank takes its inflation management seriously, and monetary policy that is too loose can cause it to increase. This makes the addition of a third round of quantitative easing by the Federal Reserve Bank questionable amidst an inflation rate that has risen to approximately 3.6 percent as of June 2011 per the Bureau of Labor Statistics.

A measured amount of inflation can be helpful, and can cushion the affect of a recession. Over a prolonged period of time however, an above rate of inflation has an eroding affect where the net benefits of lower cost of national debt and increased equity values don't stop the problem they were meant to ease i.e. the economic affects of recession. This is because the expenses for consumers and government continue to rise without economic growth leasing to less overall national worth with a higher denomination of asset values. Systemic economic issues have to be dealt with while inflationary stimulus serves to make it easier. When that doesn't work, as economists and observers have noted, the affects of monetary policy decline.

Tuesday, May 31, 2011

What the gross sales to equity ratio is used for

There are many financial ratios, some measure business liquidity, and others measure profitability. The gross sales to equity ratio measures 1. effective use of capital 2. indicates potential financing discrepancies and 3. illustrates the relationship between equity levels and sales. There are also quite a few things this ratio doesn't do such as determine the affect of seasonal and cyclical cycle on sales, but it can generally be referred to as a performance ratio and potentially be used as a variable in sales forecasts.

Complete article link: http://www.ehow.com/info_8511852_gross-sales-equity-ratio.html

Wednesday, April 27, 2011

How to create a sales forecast

There are many ways to create a sales forecast, and how a sales forecast is made is not the same as what a sales forecast is. Some sales forecasts are more accurate than others, but the information used in making the sales forecast also contributes to its validity and largely pertains to existing and pre-existing selling activities. Sales forecasts can be made by hand on paper with a calculator, using Microsoft Excel, or with a specialized sales forecast software. Essentially one or more of the following are needed to make a sales forecast:

1. Past sales numbers
2. Sales and marketing budget numbers
3. Intervals at which the numbers are attributable to
4. Other dependent variables ex. Changes in sales force
5. Calculator, or Forecasting software

Determining which sales forecast to use for your business depends on 1) market consistency, 2) historical sales, 3) changes to marketing, project management or product and service line, 4) economic conditions and 5) forecast objective. This article will illustrate how to make different sales forecasts with different tools and methods, and then discuss the importance, relevance, pros and cons of sales forecasts.


Simple sales forecast using moving average

The moving average is a trend line that calculates an average number based on historical data. For example, if sales for the last two years averaged $120K per month and rose an average of 3% per month, a sales forecast that uses both moving average and the percentage rise in the moving average will give a sales prediction based on past sales patterns.

1. List historical sales on a piece of paper or spread sheet
2. Calculate moving average
3. Determine periodic percentage increase in sales
4. Create trend line by applying percentage increase to moving average

Sales forecasts using Microsoft Excel

A few types of sales forecasts can be made using Microsoft Excel. These different forecasts use data differently or adjust data to arrive at more accurate predictions. All forecasts are predictions unless the variables are 100% constant into the future. The sales forecasts below use moving average, dependent variable i.e. causal relationships, and independent variables i.e. sales values. (Microsoft.com)

1. Create three or more columns in a Microsoft Excel Spreadsheet
2. One column for sales and another for time period
3. Click on the chart wizard
4. Highlight data box, proceed through wizard steps
5. Click on Chart tab and add trend line

For more detailed analysis of the above sales forecasting method using Microsoft Excel, regression analysis can be used to calculate accuracy of the sales forecast, and correlations. The following Microsoft website illustrates how to do this and create a forecast in excel with more detail.

Sales forecast using statistical or specialized software

Software that is designed just for creating sales forecasts can provide easier to you applications that save precious time and energy. Additionally, specialized sales forecasting software may offer a variety of forecasting options such as multiple dependent variables, easier data input templates, more dynamic presentation, and greater analytical capacity. Sales forecasting software can be found for free online via sites such as http://www.freedownloadscenter.com

Advantages and disadvantages of sales forecasts

Sales forecasts are useful tools in business management because they help refine the business process and improve the accuracy of business financial planning. Sales forecasts can also be helpful in training teams, illustrating sales performance and planning future sales efforts. Additionally, sales forecasts may assist a business obtain financing for new projects or demonstrate the need for sales related changes.
• Reduce excess inventory and storage costs
• Allow management to gauge effectiveness of sales force
• Improve strategic planning and product testing 
• Assist sales force assess their efforts and market
• Creates records for budget considerations and analysis

Sales forecasts are only as good as the variables and factors put into the equation, software or calculation. Some forecasts may be mere estimates or ball park figures of what sales might be like given non measured past patterns. Other forecasts may fail to take into account significant changes in sales staff, budgets or product line(s). Thus, knowing the business in detail can help improve the accuracy of a sales forecast.

• May not account for changes in economic conditions
• Requires business conditions to remain constant
• Does not necessarily incorporate future projects
• Numbers affected from

In summary, sales forecasts are made relatively easily but do require a record of past sales and business variables to more accurately create a forecast using a moving average trend line. Sales forecasts can compare multiple variables on a graph, in addition to being displayed on data tables. The forecast accuracy can be measured with statistical analysis and multiple methods of creating sales forecasts exist including by hand, Microsoft Excel or specialized sales forecasting software downloads. Sales forecasts are generally not 100% accurate but do assist a sales team, business management and business ownership plan for and project future business situations and revenue which helps in inventory control, assessing human resources, budget and strategic decisions.

Benefits of Listing a Company on the Stock Exchange

Image attribution: Freedigitalphotos.net; standard royalty free license

 Registering a business to be listed on a stock exchange does not necessarily require the business to be a huge billion dollar equity company. This is so as laws that enable smaller businesses to offer stocks on secondary exchanges such as the Chicago Stock Exchange or Arca Exchange allow those companies to remain private. 

Smaller public companies that wish to be listed on a stock exchange but do not meet larger exchange requirements may also have the option of listing on regional exchanges. If a company is private, the small corporate offering registration (SCOR) requirements within U.S. States is a specific form of stock offering that facilitates remaining a private company while still being able to gain access to stock exchange listing. The listing requirements and benefits vary form exchange to exchange, however finding and registering for an appropriate exchange may be well worth the cost for a number of reasons outlined in this article.


Listing requirements

Each stock exchange has different listing requirements such as historical earnings bars, share volume and stock capitalization value. These requirements may be determined by a Board of Directors and/or Executive group. Generally, the larger the exchange, the higher such bars are set but this does not necessarily exclude smaller businesses from being listed on an exchange. Rather, it determines which exchanges smaller businesses may have the opportunity to become listed on.

To illustrate, the Nasdaq stock exchange requires a minimum earnings of $11 million over three consecutive years prior to listing in addition to a minimum of one and a quarter million share float. By contrast, the Chicago Stock exchange has a tiered structure of requirements defined in part by business asset value. For example, a business with $4 million in assets must have net income of at least $400,000 in the last two years and share capitalization of $300 million for 500,000 shares with a minimum of 800 shareholders or 1 million shares with a minimum of 400 shareholders.

Benefits of listing on a stock exchange

Being listed on a stock exchange has many advantages that a business owner of any size might consider as part of a businesses strategic plan. Moreover, when expansion and leveraging are on the business agenda, stock exchange listing can cast a wider net into the capitalization pool i.e. the potential sources of equity funding. A few of the benefits of stock exchange listing are illustrated below.

• Market exposure

Through listing on a stock exchange a company is gaining market exposure to a broader membership of the financial community including market makers, buyers, sellers, and institutional traders, mutual funds and possibly hedge funds. Consequently, if a business is worth investing in, the listing opportunity has the potential to greatly increase capital investments. In other words, as opposed to private negotiations and networking, a listing on an exchange facilitates exposure to a larger financial market and wider range of investors.

• Advertising via market listings

Another benefit of listing a business on a stock exchange is the complimentary advertising that is included in the filing fee and registration. While this advertising may not be direct, the listing of a business on the exchange affords a business advertising through association. In other words being associated with the exchange and listed on it, a business is in effect advertising itself indirectly if not directly. What's more the cost of registration may be a good bargain because not only does it provide market exposure and advertising but the opportunity to generate capital investment.

• Improved brand equity through listing

Being listed on a stock exchange means that a business has met qualification standards set by the exchange. This can add credibility to a business and therefore brad equity, i.e. customer and/or client perception of value in a company and/or its products. Furthermore, in addition to the credibility resulting from the indirect endorsement from the listing, financial information and investor public relations may also be enhanced through contact information made available through the exchange listing.

• Potential for increased capitalization

A need for capital investment should be one of the main reasons a company lists on a stock exchange. Otherwise it might not be worth the time to be listed for the sake of advertising alone. Stock market listing is one of several sources of capital leveraging, but also happens to be one of the widest and most accessible forms of investment for both investors and businesses. It is largely in effect, a free market for buyers and sellers to meet, assess and trade capital for ownership and vice versa.

• Lower reliance on venture capital firms and debt financing

The potential for increased capitalization through wider market exposure may also reduce the need and reliance upon alternative sources of funding such as venture capital firms. This lower reliance for alternative sources of financing may improve negotiating leverage when obtaining financing from venture capital firms whether it be through less liability protection as determined by the stock ownership terms or lower cost of capital. In other words, if the market exposure gained through listing is positive, the effects on financing can also be positive.

To summarize, listing a business on a stock exchange may be a good idea for a business seeking improved market awareness, greater potential for capital investment, enhancements to brand equity and negotiating influence etc. Listing on an exchange should probably be in line with or in accordance with business strategy, otherwise the listing may be premature or unnecessary. Nevertheless, for companies that do seek stock exchange listing, the opportunity is there through multiple regional and national stock exchanges and different choices regarding business status and registration requirements with the Securities and Exchange Commission.

Sources:

1. http://www.chx.com/content/Trading_Information/Listing_standards.html
2. http://www.nasdaq.com/about/listing_information.stm
3. http://www.cftech.com/BrainBank/FINANCE/USStockExchs.html
4. http://en.wikipedia.org/wiki/Stock_exchange

Wednesday, April 20, 2011

Benefits of Using Microsoft Excel for Financial Analysis

Microsoft Excel does the algebra for you, and the charting, and the graphing and the statistical analysis. All that is required for analyzing financial data using excel is a few minutes to enter the data into s spreadsheet and a little knowledge about which excel tools can be used for financial analysis. This article will discuss some of those software tools and illustrate how they work.

Excel regression and statistical analysis

Regression analysis takes a set of dependent and independent variables such as sales figures and adjustments in marketing budget over 12 months and then calculates a deviation for each of those variables around the mean i.e. average dependent variable. As the independent variable changes i.e. marketing budget, the sales values may fluctuate up or down around the mean which may also rise or fall.

From the above information, excel can then calculate P-Values, betas and alphas can be found using excel which help determine the strength of the correlation between variables in addition to the magnitude changes in the independent variable are matched by the dependent variable. All these results can be charted, plotted and graphed using the regression function in Microsoft excel with just a few minutes of data inputs.

Other statistical analysis can be performed by adding in the Excel data analysis feature and some of the analysis this particular excel toolpack can achieve are the following:

• Covariance: Measures average deviation from the mean
• Correlation: The relationship between two variables
• Descriptive statistics: Includes a wide range of calculation that describe data
• ANOVA analysis: Analyzes and contrasts two information categories
• Ranks and Percentiles: Descriptive statistics that categorize and organize variables

Histograms, scattergrams, pie graphs and bar charts

By entering data into a spreadsheet in excel one is making possible the conversion of that data into graphical display which can lead to a potential host of other benefits. There are several types of graphical and pictorial display of data that can be accomplished using Microsoft excel including the aforementioned charts, graphs and plots. Each graphical display allows the information to be displayed in a different way such that relationships and changes to the variables over time can be observed. A few of the benefits of these excel tools are the following:

• Improves presentation
• Aids analysis of information
• Helps financial decision making
• Communicates financial ideas

Descriptive statistics

Summary statistics take numerical data and reconfigure it into analytical metrics. For example, if one has a list of weekly customer counts for an annual or 52 week time period, that data can be summarized using a number of excel tools. For example the weekly client count can be organized by rank from highest to lowest or lowest to highest. Some of the descriptive statistics made possible through Microsoft excel include the following:

• Moving average: Changes in the mean over time
• Standard error or t-test: Summary of standard deviation using square root
• Standard deviation: Used to determine range of movement of variables
• Skewness: A non-normal distribution of data after being plotted
• Range: The low and high ends of a data distribution
• Mean, median and mode: average, middle and most frequent numbers
• Count: Total value of data

The above descriptive statistics can assist in determining potential future client counts, averages, fluctuations over time and fluctuation levels. While alone descriptive statistics might not be as useful in making financial decisions as with the aid of other excel tools, they do summarize data in a form that can be analyzed more easily.

Microsoft excels data analysis tools can be applied to financial data of many types. For example, product sales, costs and expenses, price movements, taxes etc. can all be measured, plotted and analyzed using excels analysis tools. What's more, the financial data of more than one business can be compared for assistance in determining market conditions and other in house vs competitor financial data.

In summary, Microsoft excel organizes, analyzes and calculates using financial data using the software's built in metrics and features. These tools can benefit a business in a number of ways. For example, the resulting statistics may assist a business manager determine how to adjust a budget, or which clients to spend more money advertising to. Also, the financial analysis may demonstrate how much a companies worth changes over time thereby informing the manager and/or owner as to whether valuation is to volatile or stable for the business climate.

Excel also analyzes data using pictorial displays that can assist a financial analyst determine percentage distributions, proportions and relations between financial products and variables, changes in financial data over time, accuracy of the software analysis outputs and possible causes for changes in data values. In other words, Microsoft excel organizes, present and analyzes financial data in such a way that further analysis, insight may be gleaned, and decision may be made from the resulting analysis.

Source:
1. Albright, Winston and Zappe. 'Data Analysis and Decision Making with Microsoft Excel' Albany, NY. Duxberry Press.

Tuesday, April 12, 2011

The eifference between debt and equity financing

Companies use debt and equity financing to leverage capital expenditures, project development and operational expansion. Without leveraging company's financial growth is limited to retained earnings. For this reason debt and equity financing are often times considered vital to business expansion. Both debt and equity financing have advantages and disadvantages associated with them. This article will illustrate both forms of financing then come to a reasoned conclusion as to when and why each form of financing can be valuable.

Debt sources of financing

Debt financing includes collateralized bonds, debentures, business loans from banks, and lines of credit. Generally debt financing comes with an interest rate somewhere between 3-8% depending on the type. For this reason debt financing can be less expensive than equity finance depending on the expectations of the equity financiers. Debt financing may not always generate enough capital to perform intended business projects and goals as this type of financing tends to be more conservative in its lending requirements.

Equity sources of financing

When using equity as a source of financing a company is seeking capital from investors through the issuance of shares. These shares can be common or preferred i.e. having voting rights or priority in the case of company liquidation. Equity financing can also take the form of employee stock options which replace direct pay in the form of a corporate benefit. In the case of common and preferred shares, equity financing can be variable based on stockholder expectations and type meaning the higher the expectations, the higher the cost of financing.

Advantages and disadvantages of debt and equity financing

In business, both debt and equity financing have their advantages. Debt financing from financial institutions is subject to formal approval from lenders and monitored by organizations that rank the quality and credibility of corporate bonds. For this reason, debt financing can not only be a source of cheaper leveraging, but also an indicator of how viable a projects and goals actually are in terms of how convinced lenders and analysts are about the quality of the debt.

On the other hand, in a competitive market place, venture capital and equity financing can mean the difference between innovation, market share and a competitive edge. Often, such ventures can have more risk and therefore demand more return on investment making the financing more expensive. Nevertheless, if a business can garner a return on capital greater than the cost of goods and services including equity costs, then those projects become profitable.

Depending on the type of business, competitive ventures requiring excessive equity financing may simply be unnecessary, impractical or not in accordance with the goals of the business owners. In other words, not all businesses are designed to rapidly expand and yield growing profits on an annual basis. Businesses that simply intend on yielding a steady profit on an annual basis may benefit more from debt financing because of its structured and cost effective nature.
In the case of Equity financing, businesses that lack credibility, start ups and rapidly expanding businesses however may make positive use out of equity financing not only because it may be the only source of capital around but because it can provide the leverage necessary to accomplish the corporate vision.

Summary

Financing is a form of leverage not uncommon to most businesses in one form or another. Smaller businesses tend to use less, fixed or no equity financing due to corporate goals, cost of financing and business size. Contrarily, large high-powered industry leaders and high growth firms may find it essential to raise capital through equity financing to accomplish annual forecasts, corporate goals and owner objectives. Each form of financing has its advantages and disadvantages as this article has illustrated, but in the end financial leveraging is something that may be required for business survival and profitability regardless of cost.

Sunday, April 3, 2011

How Vendors Can Help You Fund Your Business

Vendors have a vested interest in the success of their clients and thus are likely to be supportive or understanding of clients' financial needs. This aspect of the vendor/client business relationship positions vendors in unique positions to assist with financing business cash-flow and working capital needs.

Since vendors are also suppliers of wholesale products and in some cases are also franchise shareholders of businesses, there may be several ways by which they may be able to help finance a business. The following illustrates types of client/vendor relationships, how those relationships can influence financing and the various methods of financing assistance vendors can provide.

Franchise vs independent business

Vendors may also be franchise partners or owners meaning their stake in the business' performance is considerable in terms of capitalization, supplying, managing and branding. For example, McDonald's franchise owners are subject to licensing requirements held by the franchise supplier i.e. McDonalds Corporation. The terms of that licensing relationship may include explicit financing assistance and/or terms.

In the case of independent businesses, the relationship with vendors may not as strong but still important. If a business has had a long standing relationship with a vendor that vendor may be more than willing to assist with financing in a number of ways. Depending on the size of the vendor and the nature of the business, they may even have their own banking division.

Vendor financing methods

• Advertising 

Vendors are companies too, therefore any advertising a client business can offer the vendor is worth money to the vendor. In return for certain advertising, vendors may offer deals which may include but not be limited to financing arrangements, discounted supplies and/or favorable business terms.

• Loans 

Large, heavily capitalized, nationwide vendors may also own financing companies that act as subsidiaries in the interest of the parent corporation. An example of a financing subsidiary and/or shareholder relationship is GMAC financial services as owned in part by General Motors Corporation. In the case of GMAC, financing is and was made more available to vehicle buyers and vehicle sellers when the need arose. Vendors with or without ownership in financing firms or subsidiaries, may be willing to assist in offering loans and/or capital for financing a business not only as a profit venture, but as a means by which to facilitate the vending, distribution and sales of their primary business of supply.

• Equity Investment 

A vendor corporation may also be interested in becoming a shareholder or partner depending on the type of business the client operates. This allows vendors both greater influence in the managing of a business, but also a potentially mutually beneficial business relationship in which the business owner becomes better capitalized, and the vendor acquires profit potential and/or greater continuity in vending supply.

• Supply Terms 

If a company uses a cash basis of expensing, money becomes due upon receipt. In the case of inventory on a cash basis receipt, this can involve significant up front expenses. Due to this, many suppliers and/or vendors offer credit accounts in which payment is made after delivery of a product. These terms may be negotiable in terms of interest, time periods and wholesale prices.

• Business network 

Vendors themselves may acquire financing from banking and/or venture capital investors. If the vendor has confidence in a particular business, they may be able to provide a referral or recommendation for either loan or capital financing.

The vendor/client business relationship can be a strong one. It is for this reason that vendors may be unique sources of potential financing of a small business. Depending on the extent and type of the business relationship a client and vendor have, there are several mechanisms by which financing can be achieved. These methods of financing include but are not limited to direct financing, service barter, negotiation of business terms, capital and/or equity investment and financing referral.

Guide to Commerical Secured Loans

Commercial loans are borrowed funds that assist businesses finance aspects of business operations that require immediate capital. These loans may be acquired from a number of sources including commercial banks, other companies, or private lenders, and are in many cases not used to finance large purchases such as buildings, other companies, or land real estate. However, asset backed commercial loans are used for longer term financing such as in the case of corporate acquisitions, large and expensive equipment and property. Below are some examples of secured commercial loans in a broad sense of the term:

• Secured business line of credit
• Business mortgage 
• Corporate asset backed security loans
• Secured debentures 
• Short term secured equipment loan 
• Acquired asset backed term loans

Secured commercial loans are collateralized with something of value that is owned by the company seeking the loan. This provides the bank more security in the case of loan default, failed forbearance or delinquency. Some examples of assets that may be acceptable collateral by commercial loan lenders are listed below. However, it may be useful to note some lenders may only consider a few types of collateral for the sake of simplicity and lending policy.

• Inventory
• Accounts receivable
• Liquid assets such as bonds, and equities
• Property, plant or equipment
• Legal settlements
• I.T. applications, patents and property liens

Where to get a commercial secured loan

As mentioned above, lenders of commercial loans include various financial institutions, companies, or private lenders. Depending on the business structure, sought after loan terms and amount, those willing and able to lend can vary. For example, a small commercial bank will be in a less suitable position to finance a large fortune 500 company seeking a short term commercial loan than a larger financial institution. The following link is a sample commercial loan application from regalfinancialbank.com.

To elaborate further, some financial institutions may not take a preference to collateralized lending over other aspects of companies finances such as monthly net income and revenue in relation to cash outflow and liabilities. Different locales, regions and countries may offer different types of commercial loans so it is important to research the loan specifics to match the loan requirements. Below are few examples of U.S. commercial lenders and financial institutions that finance secured commercial loans.
• CIT 
• Wachovia Corp.

What to look for in a commercial secured loan

Secured commercial loans may be simple or complex depending on the needs of the company, size of the loan and terms of the loan itself. In some cases law firms may facilitate the legal documentation of secured commercial loan transaction whereas in other cases the loan may follow a more standard agreement and terms. Sometimes than can impact the potential benefits of a commercial loan are listed as follows.

• Competitive interest rate
• Length of loan
• Fees, surcharges and/or additional costs
• Interest and/or penalties for default indemnification
• Percent and/or type of assets used as collateral 
• Down-payment and insurance if any

Other things to look for involve the commercial loan lender itself. The lender's financial solvency, location(s), variety of loan products, ability to service a loan and experience in the industry can all be relevant to a obtaining a secured financial loan. If the loan is complicated and difficult to obtain, this may be an indicator of the lenders capacity and willingness to lend.

Summary


Secured commercial loans are asset backed loans used to finance business activities or purchases needed in short term operations. However, in some cases long-term asset backed commercial loans are financed, a common example of which would be a commercial mortgage. Specific financial institutions that specialize in commercial loans, corporate lenders and private lenders may offer commercial financing.

The type, terms and availability of commercial loans can be an indicator of how likely and easy it will be to find financing for such a loan. The more complex, large and uncommon the loan, the more likely it may be the loan will have to be customized and facilitated through legal and commercial negotiation. With all secured commercial loans, the terms, charges and details of the loan are important in determining the advantages and competitiveness of the loan.

Sources:

1. http://www.businessdictionary.com/definition/commercial-loan.html
2. http://www.gelending.com/Clg/Resources/lendingFAQs.html#Faq8
3. https://www.chase.com/index.jsp?pg_name=ccpmapp/commercial/prod_serv/page/cbc_faqs
4. http://www.fwwlaw.com/showarticle.aspx?Show=291

Thursday, March 31, 2011

How Net Present Value is calculated

The Net Present Value (NPV) calculation makes use of an important time variable to tell you 1) the value of an investment at present time given future cash flows and 2) if the investment is worthwhile. Net Present Value is important in valuation of projects and investments because the combination of estimated value based on cost, yields and cash flow can sometimes paint an inaccurate financial mirage without quantification of the variables.

Another reason why Net Present Value calculations are useful is because they can help determine if an investment or project is more profitable than it actually is in less uncertain terms. With numerical figures entered into a proven formula, the only factors that may be questionable are the future cash flows and cost of capital. Moreover, if these can be reliably estimated, the resulting NPV stands a greater chance of accurately predicting present value. 

When NPV calculations are used 

If you buy a bond and know the periodic interest rate, and will receive the face value of the bond at a specific point in time like 10 years, then fair valuation would price the bond at the present value of all future payments. Present value adds up all the interest payments, and the difference between the initial purchase price of the bond and the future reimbursement to arrive at a present value. In another circumstance maybe a bond is bought from someone else several years after it was originally issued and you want to know the price. Net Present Value would factor in additional costs if the bond investment were considered as a project.

Perhaps you are a project manager and are attempting to illustrate the value of a project to another executive. The Net Present Value calculation will mathematically give you the total value of an investment's returns that are in the future and are based on key variables including 1) the cost of capital, 2) time, and 3) negative and positive cash flow. Two more examples of circumstances in which NPV calculations may be used are below:
• Example 1: Your business purchases tax free bonds with some of its earnings. The bonds pay 5% every 6 months for 10 years at which time the face amount of the bond is either redeemable without penalty or rolled over. You are trying to calculate how much you should pay for the bond not to be overcharged and use a NPV calculation to do so.
• Example 2: Your company is thinking about investing in a project and wants to know if the opportunity cost is lower than the rate of return for the project. You know how much the initial investment is and have a good idea of what your annual returns will be and how much, if any, the financing of the project will cost. The NPV calculation can help you with the decision.

NPV calculations and methods of calculation

Net Present Value can be calculated in a number of ways and a number of different NPV calculations exist for varying circumstances. In other words, due to differences in variables used, Net Present Value calculations can differ. For example, a bonds can provide either fixed or variable rates of return. Both cases require different calculations. Additionally, cash flows can vary from year to year due to changes in project success and/or cost. NPV can be calculated manually, with regular or financial calculators or with financial software. Examples of NPV calculations are below:
• Calculating Net Present Value against costs of capital and opportunity cost for a fixed rate bond 

Variables: Term of the bond 10 years
Fixed rate of return 5% annual
Future Face Value: $ 5000.00
Interest payments: Bi-annual

Step 1: Calculate present value:
$5000.00 x 5%= $250.00 x 10/20=$125.00
$125.00 x 20=$2,500 + $5000.00 =$7,500.00
The bond is worth $7,500 at present with all cash flow included

Step 2: Reduce value by cost of capital
Cost of capital, inflation + opportunity cost
3.35% (est .avrg)+2% (est. return after risk reduction)
=5.35% = $3210.00+$5000.00=$8,210.00

Step 3: Subtract present values for net present value
$8,210-$7,500= -$720.00
NPV= - $720.00

Conclusion: The bond is a bad investment based on cost of capital and opportunity cost discounting.
• Calculating Net Present Value with inconsistent cash flow

Variables: Project down payment $5000.00
Cost of financed capital (Annual project yield -Annual project cost): 12% per year
Time period: 10 years
Cash flows: Between 12-18% ascending return per year

Step 1: Calculate present value of each individual estimated cash flow
Y1: $600.00 Y2: $625.00 Y3: $650.00 Y4: $675.00 Y5: $700.00 Y6: $825.00 Y7: $850.00 Y8: $875.00 Y9: $900.00 Y10: $900

Step 2: Present value for each future year's payment equals percentage yield plus value to which that yield can be added to amount to the future yield. EX: $600 =$535.71 x 12%., $625.00 =$498.246 x 12% for 2 years.

Step 3: For each year add the present value to arrive at Net Present Value. Ex. $535.71 + 498.25= $1033.96 for 2 year Net Present Value.

Source:

Brigham and Houston. 'Fundamentals of Financial Management 9th ed.' Mason, Ohio. South-Western, 2001, Chapters 8 + 11.

How The Law of Increasing Costs Works

The 'law of increasing costs' is an economic concept that states production costs will increase if maximum output efficiency has already been reached with fixed inputs i.e. overhead and other expenses. Once maximum efficiency of production is reached, the law of increasing costs states the cost to produce more will increase thereby lowering profit margin via increasing costs.

Illustration of the law of increasing costs 

The law of increasing costs can be illustrated with the example of a restaurant's file mignon operation. In this operation, maximum efficiency or profit margin is attained when 3 chefs produce 12 filet mignons per hour when operating with maximum efficiency while the costs of cooking the meat is constant i.e. ingredients, electricity, and wages, then increasing the number of filet mignons cooked in one hour will cost a company more than producing less.

Inputs and outputs:

• 3 Chefs produce 12 filet mignons in 1 hour
• Electricity, ingredients and wages are constant
• The Chefs are working at maximum efficiency

If the above illustration costs a restaurant $91.00 divided as $15/hr per Chef, $3/filet and $10 for 1hour of electricity and overhead, the restaurant will have to increase this cost to produce more filet mignons. This will cost the restaurant more in overhead, wages and ingredients that could negatively offset maximum profitability via the increase in cost.

Costs:

• $3.00 per filet
• $10 of electricity and overhead per hour
• $15.00 hourly Chef wages

To illustrate further, the restaurant sells the filets for $9.50 each or $114.00 before tax for a profit of $23.00. If the restaurant wants to produce 15 filet mignons they will either have to hire 1 more chef, buy more filets and use more overhead. This additional increase will cost $15.00 for the Chef, $9.00 for the filets and $3.33 for electricity and overhead for a total of $27.33. 15 filets sold at $9.50 are $142.50 for an additional $27.33 of cost. The total cost is now $91.00 + $27.33=$118.33 and the profit is $142.50-$118.33=24.17. Thus the costs increase more than the profits to produce more filets confirming the law of increasing costs. Stated otherwise, with maximum efficiency at 12 filets/hour, the restaurant makes 25.27% of cost i.e. profit margin or 20.17% of total revenue whereas with 15 filets produced the restaurant only earns 20.43% of cost or 16.97% of revenue.

Validation of the law of increasing costs

The law of increasing costs can be both confirmed through cost adjustment profit margin comparisons. Moreover, in the world of business, costs only remain fixed for relative periods of time making the maximum efficiency in production also variable. This can be illustrated by adjusting an calculating profit margin for adjustments in Chef's time spent working and the number of Chefs. For example, if filet costs rise to $3.50 per filet due to a drought that causes feed costs to rise, then the maximum profit margin will remain at 12 filets as stated in the above example. This will be illustrated by comparing 2 separate adjustments in comparison to the original efficiency level or 'control' level above.

• Effect of filet cost increase on original efficiency

To illustrate how efficiency is stable at a certain rate regardless of Chefs used, time spent cooking and cost of filets the following examples are illustrative. If the Chefs produce 4 filets each per hour at the increased filet cost of $3.50, 12 filets will be produced as in the previous illustration. However, all other costs held constant this amounts to $114.00 in sales minus $97.00 in cost=$17.00=17.525% in profit for a 7.74% decrease in profit margin for a .50 cent rise in per unit cost.

• Effect of hiring a 4th Chef on profit margin

If a fourth Chef is hired, 15 filets will be produced at a cost of $60.00(wages) + $52.50 (filets)+$13.33 (overhead)=$125.83. At $9.50 per filet this new production of 15 filets yields $142.50 in sales. $142.50-125.83=16.67, which is 12.03% less profit margin.

• Effect of reducing time spent cooking on profit margin

Contrarily, if the Chefs only work for half an hour however, and produce only 6 filets, the cost goes down $22.50 in wages, $21 for filets, and $5.00 in electricity and overheard for a total cost of $48.50. Since the filets are sold for $9.50 each without adjusting for cost, the total sales will be $57.00 minus $48.50 in cost for a profit of $8.50=7.92% decrease in profit margin.

While reducing the cooking time decreases profit margin by a similar amount to holding all other variables constant except filet cost, the original example still yields a slightly greater efficiency i.e. 7.92%-7.74%=.18% difference in favor of the original method.

Despite the above validation of the law of increasing costs, there is still evidence the law is not absolute via certain additional adjustments and/or scenarios. For example, in instances, where increasing per unit cost has a multiplier effect on potential profit margin, the law of increasing costs does not apply. 

To illustrate this example, consider the application of exponential increase in output for linear increase in input. Since exponential increases are greater than linear increases, the efficiency will rise with linear increase in input. Moore's law and computing components (answers.yahoo.com) illustrate this point. As technology advances, output of computers increases more than the per unit cost in enhancing the technology.

Summary

The law of increasing costs is similar to the law of diminishing returns and can be illustrated using the law of diminishing returns that states costs will increase as evident in a decrease in returns when production levels surpass maximum profitability and/or efficiency levels of production. This article illustrated this law through the example of 3 Chefs producing filet mignon at a restaurant with costs held constant and adjusted. 

In all examples, the efficiency level was not contradicted. Nevertheless, the law of increasing cost is not absolute as evident in certain scenarios such as the application of exponential output via application of Moore's law to linear increase in cost input. While Moore's law itself is debatable, the example serves to illustrate cases of increased efficiency are possible when exponential or larger production is possible for a corresponding declining percentage increase in input costs.

Sources:

1. http://en.wikipedia.org/wiki/Diminishing_returns
2. http://answers.yahoo.com/question/index?qid=20060907234254AAULjAS
3. http://en.wikipedia.org/wiki/Moore's_law
4. http://mmcconeghy.com/students/supscruleof70.html

Understanding the accounting concept of cash flow

The accounting concept of cash flow provides insight into businesses operations and cash positioning at the time the cash flow is recorded. Cash flow in its simplest form is the sum of cash that moves in and out of a business, specifically in terms of business operations, financing i.e. borrowing activities and investing activities. These three elements of cash flow are frequently recorded on the cash flow statement. (investopedia.com)

Cash flow statements, which became mandatory financial reporting statements in 1987 (ibid) illustrate cash details not included in other financial documentation. Since net income includes revenue owed but not received, this net income calculation can fall short in accurately reporting a companies complete financial position. (Brigham and Houston p.48) For example, net cashflow subtracts depreciation, amortization and cash receivables that haven't been received from net income (Ibid)

Why cash flow is important

Cashflow is important because it provides financial analysts, managers, shareholders and regulatory institutions such as the Securities and Exchange Commission (SEC) or the Federal Deposit Insurance Corporation (FDIC) with more detailed information regarding a businesses cash inflow and outflows. This information is useful in determining several factors regarding a business or company's use of cash. A few of the insights and facts revealed by a cash flow statement include the following:

• Demonstrates efficiency of cash utilization
• Allows for more comprehensive financial reporting and identification of cash usage
• Cash flow returns over time i.e. with several cash flow statements
• Operating, financing and investing activities
• Information used in calculating cash flow ratios and equations ex-net cash flow
• Assists in determining business valuation *Allows for more comprehensive financial reporting

How cash flow is measured 

Cashflow and information within cashflow statements is used in measuring several useful accounting and financial functions. Three such metrics include 1) net cash flow calculation 2) cash flow ratios and 3) cash flow based calculations such as present value of cash flows and internal rate of return. (wikipedia) Since the cashflow statement is divided into three sections included cash flow from operations, investing and financial activity, different ratios can be formed using each area of the cash flow statement. For example, the operating cash flow ratio is determined by dividing operating cash flow by current liabilities. (Brigham and Houston p.56) A few of the different cash flow ratio metrics are listed below.

• Operating cash flow ratio
• Price to cash flow ratio
• Free cash flow ratio
• Cash flow to debt ratio
• Working cash flow ratio

Additional cash flow measurements such as present value of future cash flow and internal rate of return use cash flow values to determine how much a series of cash flows are worth in terms of achievable interest rates as applied to each cash flow over time in the case of present value of cash flow (Brigham and Houston p.294) and matching costs to present value through adjustment of interest rate in the case of internal rate of return or IRR. (Ibid. p.509). These latter two calculations are quite important in bond and project valuation because they allow investors and managers to determine reasonable assessment of valuation and worth.

Both present value of future cash flows and internal rate of return can be calculated by using the functions of a financial calculator. For example, if a business has a 12 annual cash flows of $100, that are able to earn an interest rate of 10% upon receipt and where the first payment is received at the beginning of the first year the following function buttons can be used. N (Number of payments), I (Interest rate), PMT (Payments/Future cash flow), and FV (Future value). (Brigham and Houston p.295). 

To calculate the present value of future cash flows first determine the future value for poseterity by entering the values using these function buttons. For example, N=12, I=10, PMT=-100, PV=0 then CPT (compute) FV=$2138.428. Since payments are reversed the value is recorded as negative. Then, to compute the present value of the future cash flows, enter the same values except enter $0 FV and compute PV for a value of $681.369. (Ibid.p305) This is also called an annuity cash flow present value.

Summary 

Cash flow is a vital part of business operations and is often reported on the 'cash flow statement'. Cash flow is the movement of cash in and out of a company for various purposes over a given time and as recorded in the cash flow statement. Cash flow records can be used for a variety of financial and accounting purposes including valuation, assessing business management decisions, determining cash solvency via cash flow ratios, and illustrating how and where cash is used in a company. The cash flow within a company is a dynamic and important aspect of business operations, financing and investment for which the ideal balance of cash usage varies depending on type of business, economic conditions, business management and accounting reporting requirements.

Sources:

1. Eugene F. Brigham and Joel F. Houston. '0Fundamentals of Financial Management 9th edition'. Mason, Ohio. Southwestern, 2001. P.48-52.
2.http://www.answers.com/topic/cash-flow-statement 
3. http://www.investopedia.com/articles/04/033104.asp 
4. http://en.wikipedia.org/wiki/Cash_flow 
5.http://www.exinfm.com/board/cash_flow_ratios.htm 
6. http://www.candlestickforum.com/PPF/Parameters/11_1262_/candlestick.asp